CWU Sustainability
Therms and Electricity Data
CWU is carefully tracking its electricity and gas consumption, and working to reduce consumption despite increasing building square footage.
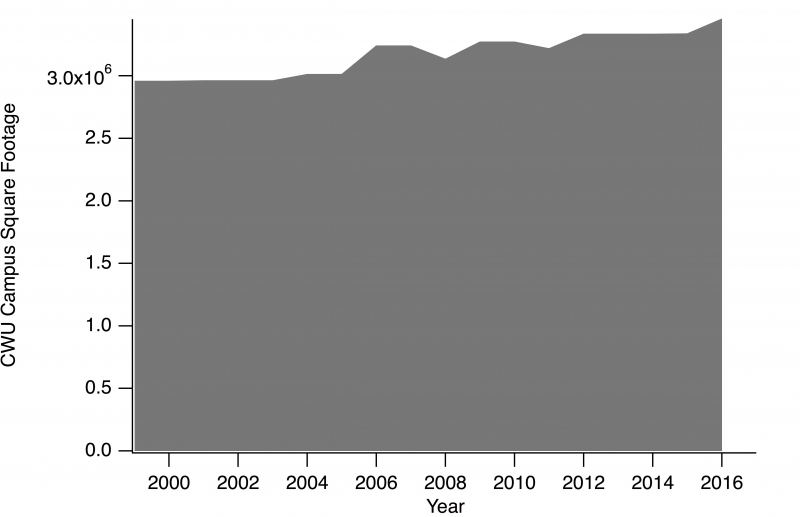
The size of CWU's building footprint (campus square footage) increased during 1999-2016 with the addition of new buildings.
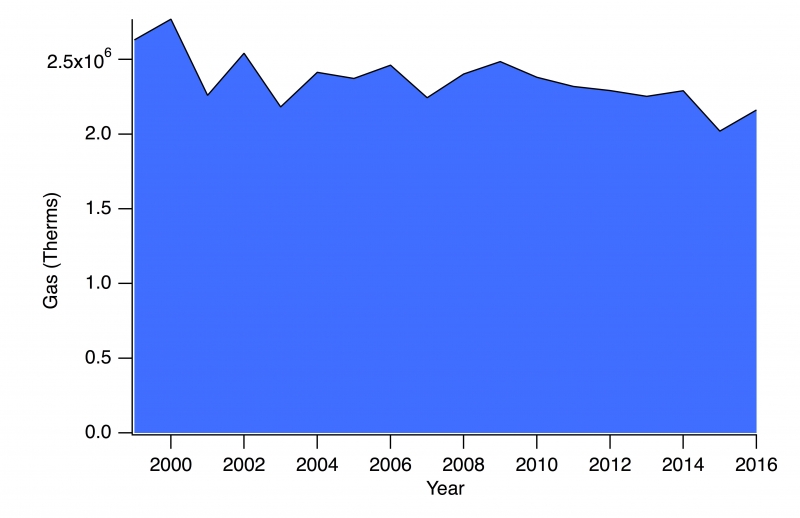
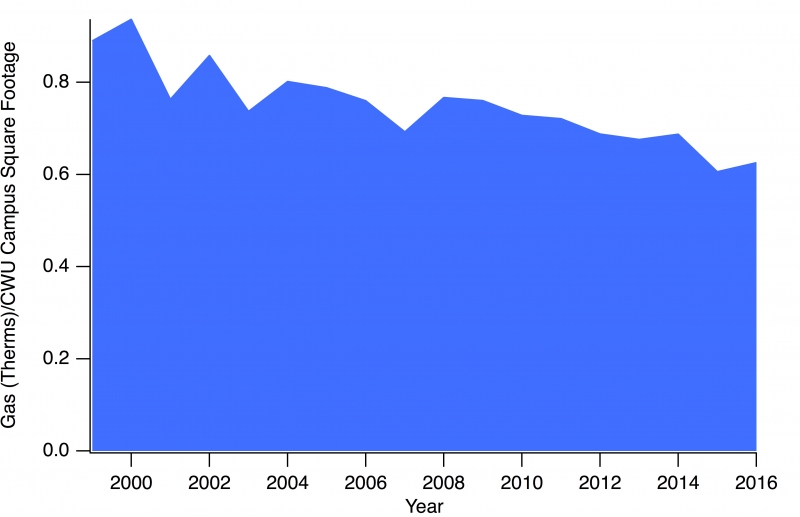
With improved energy efficiency measures, consumption of gas (therms) has decreased during this time, despite the increase in campus building footprint.
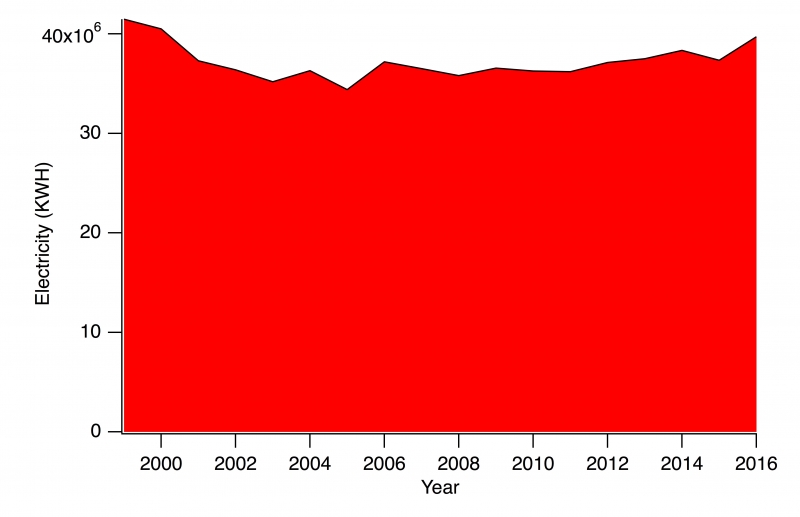
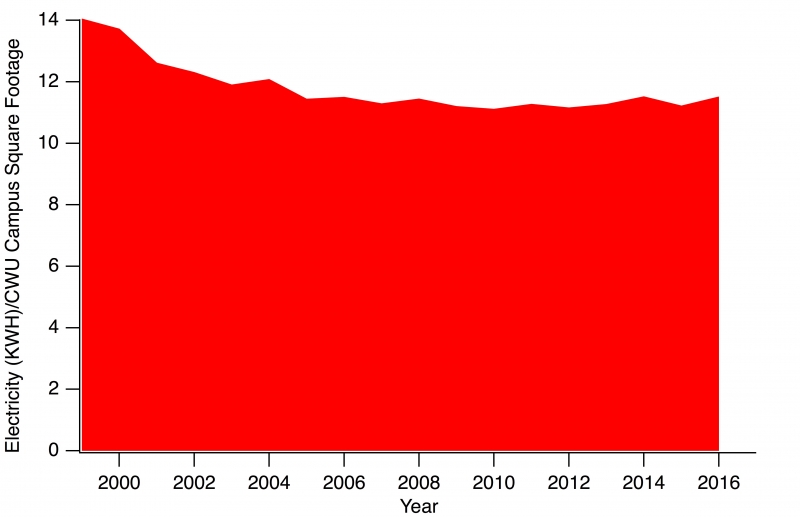
CWU electricity consumption (1999-2016)CWU electricity consumption/square footage (1999-2016)
Total electricity consumption at CWU has fluctuated over time with changing square footage. The electricity/campus square footage data indicates electricity efficiency improvements over time.
CWU News

CWU to host nationally recognized conservationist tonight at The Ridge
May 11, 2026 by Marketing and Communications

Two CWU Nutrition students earn awards from leading national organization
May 11, 2026 by Rune Torgersen